Cost Benefit Ratio Analysis for Cycling & Crossrail 2 in London
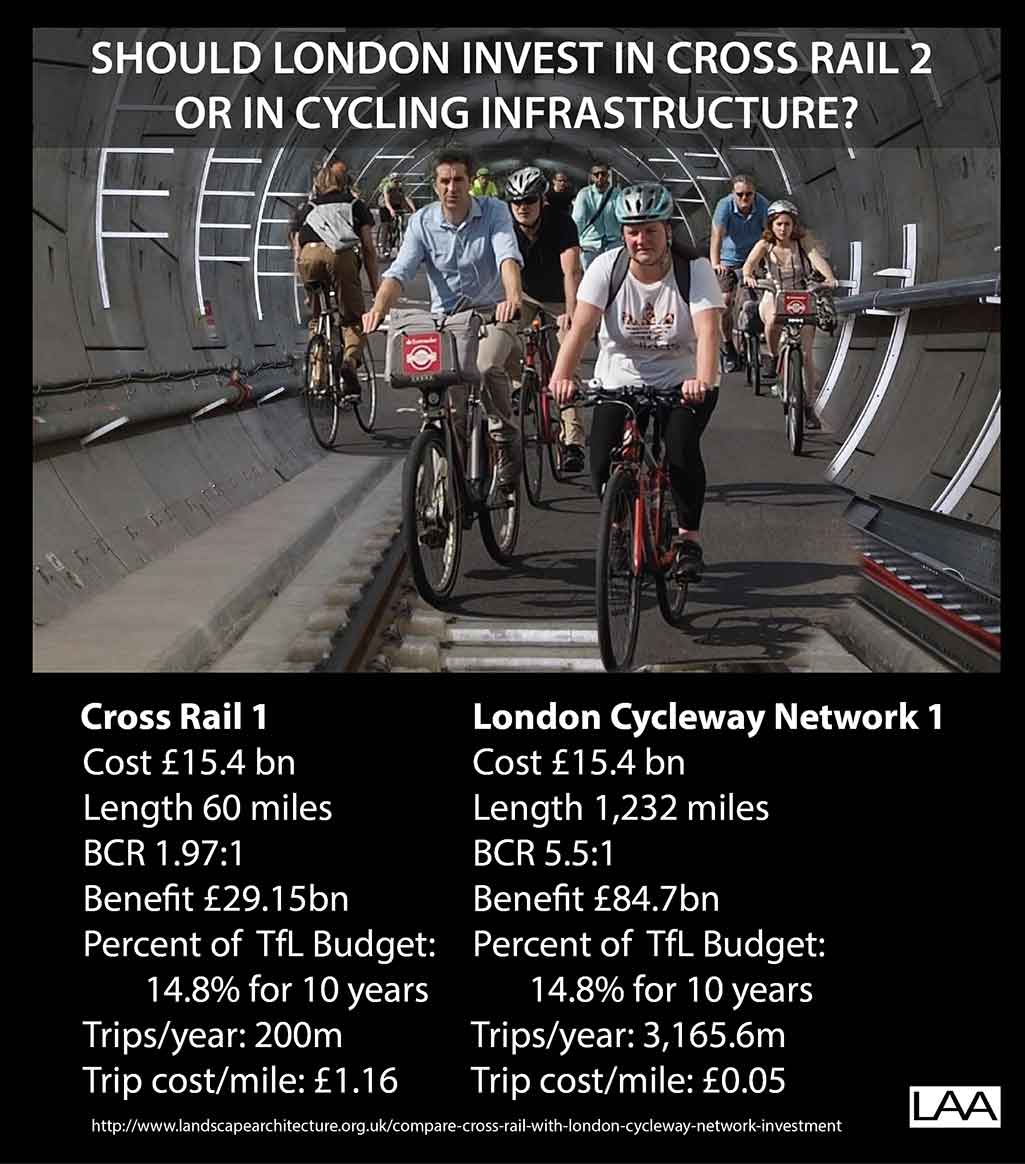
In 2018 it was announced that the opening of Crossrail 1 will be delayed by 12 months and that it will cost at least an extra £600m (up from £14.8 billion to £15.4 billion). In 2019 this will be 3.8 times as much as Mayor Khan plans to spend on cycling (£154 million /year). Crossrail 1 was given the go-ahead in 2009. It was assumed that it would yield £1.97 of benefit for every £1 it cost (ie a Benefit Cost Ratio of 1.97:1). Crossrail 2 might cost another £15.4bn. So let’s compare investing in Crossrails with investing in a London Cycleway Network (the figures and assumptions used in the calculations can be found in the Notes below):
| Crossrail 1 | London Cycleway Network |
| Cost £15.4 bn | Cost £15.4 bn |
| Length 60 miles | Length 1,232 miles |
| BCR 1.97:1 | BCR 5.5:1 |
| Benefit £29.15bn | Benefit £84.7bn |
| Percent of TfL Budget: 14.8% for 10 years | Percent of TfL Budget 14.8% for 10 years |
| Expected trips/year: 200m | Expected trips/year: 3,165.6m |
| Capital cost/mile: £202m | Capital cost/mile: £12.5m |
| Trip cost/mile: £1.16 | Trip cost/mile: £0.05 |
| Maintence: £1bn/year? | Maintenance: £1m/year? |
The advantages of investing in cycle infrastructure are clear, and it has and there are other advantages:
- Parts of the cycle network can be opened phase-by-phase during the construction period.
- The annual maintenance costs of cycle infrastructure are negligible (some litter collection and a few repairs).
- The running costs of a cycle network do not contribute to climate change or global warming.
- Operating cycle networks makes little use of scarce and expensive energy resources (except for traffic lights and other information provided to cyclists).
- Physical exercise helps prevent the diseases that result from obesity and lack of exercise (this is a factor in the high BCR of cycle infrastructure)
- Cycling does not cause air pollution
Notes on cost benefit analysis for cycle infrastructure investment
-
- The evidential base for the above figures is admittedly rough and ready – so comments are welcome. It’s a while since I was an economics student.
- A cycleway is defined as a way that is designed for cycling. This does not include the signposted cycle routes which were misleadingly promoted as a London Cycle Network
- The cost of building cycleways is taken to be £12.5 million/mile, based on the 5.6-mile section of CS9 between Olympia and Hounslow. This compares with the £202 million/mile for Crossrail. Crossrail within the GLA area has a much higher cost/mile because of the tunnelling.
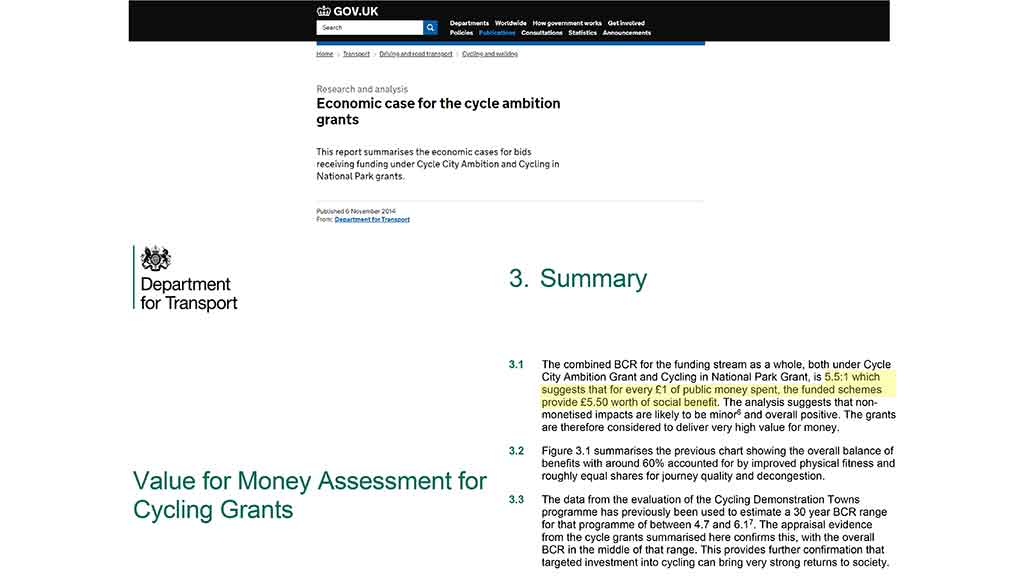
- The BCR comes from the 2014 Department of Transport report Value for Money Assessment for Cycling Grants.
- TfL manages the Transport for London Road Network (TLRN) and should create a London Cycleway Network, on TLRN, on non-TLRN roads and in other public open spaces. TLRN is a network of 360 miles which comprises 5% of roads in London by length and carries 33% of London’s traffic.
- Total travel in London using TfL mechanised transport is 27.1 million trips on an average day (*365 = 9,891.5 million trips/year). TfL expect Crossrail to carry 200m passengers/year, which will be 2% of all journeys on the network. This compares to the 2.5% of transport trips by bicycle in London in 2014.
- TfL say the number of cycle trips in London has ‘doubled in a decade’ as infrastructure has been upgraded. This puts London in 248th place on the Cityclock table of 700 Cities ordered by Cycling Mode Share. The above table assumes that 1,232 miles of high quality cycleway (CS3 Embankment quality, at least) will raise the cycling mode share in London to the Beijing level of 32%. This would be 3165.6 million trips/year which is 15 times as many as Crossrail. Beijing has more high-rise buildings than London but, physically, is not as different a city as one might think. Amsterdam and Copenhagen are capital cities with mode shares which are now over 40% but they are much smaller cities than London. Beijing has a very good network of roadside cycleways but would find it much more difficult than London to run cycleways through green open space or to create the greenway-cycleways favoured by landscape architects.
- The average cost of travel by tube train in London is £1.16/mile. Crossrail journeys will be more expensive. Cycle travel costs about 50 calories/mile in human energy and occasional expenditure on equipment. The energy can be obtained from a thin slice of wholemeal bread costing about 5 pence (18 slices for 90p). If one eats too much, getting rid of 50 calories in a fitness club might cost £10/month so 5p/mile seems a reasonable figure.
- Worldwide, few mass transport systems run at a profit so all the revenue is spent on maintenance. Cross Rail Phase 1 is expected to have ticket sales of £900 million per year by 2022. so maintenance may be £1bn/year.
Cross Rail is a welcome improvement to London’s transport systems. But in value for money terms it is not nearly as worthwhile as investing in high quality cycle infrastructure.
See also:
Tom Turner