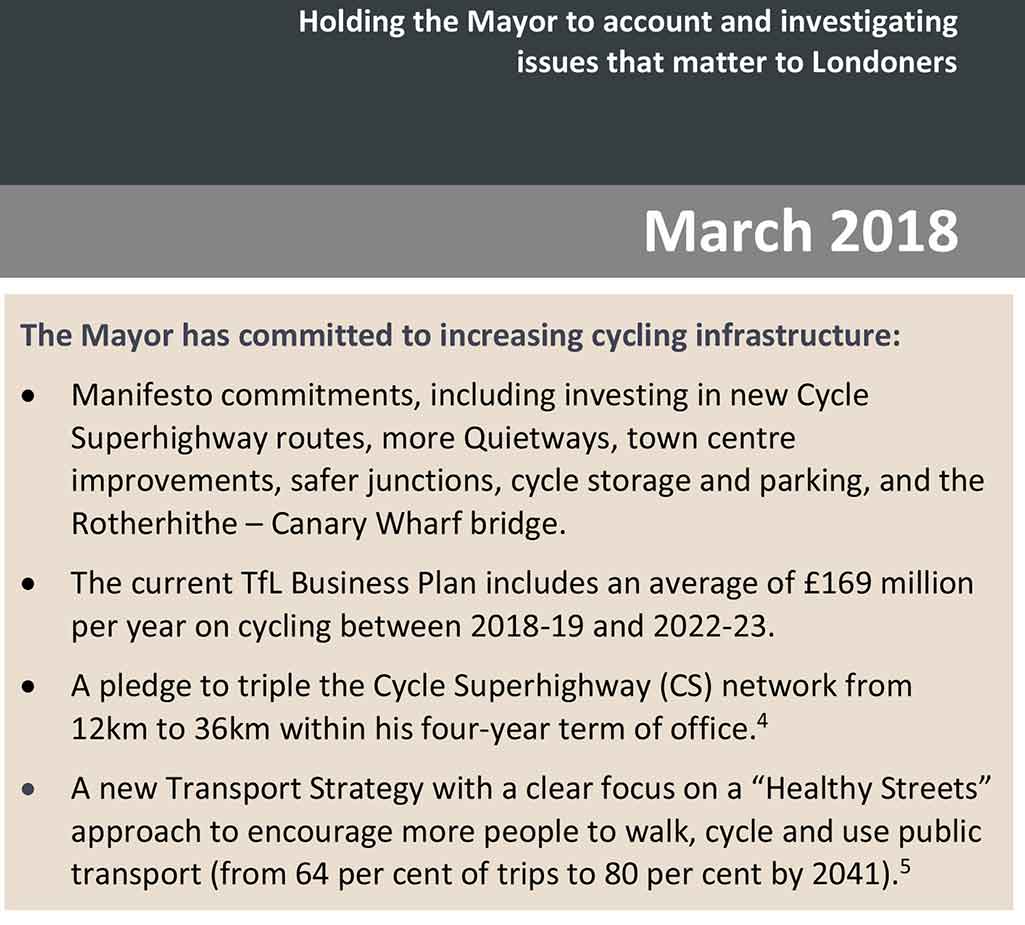
Costing and phasing London’s Cycleway Network
Should London’s cycling infrastructure be planned for a mode share of 9% or 41%? And when should the plan be implemented?
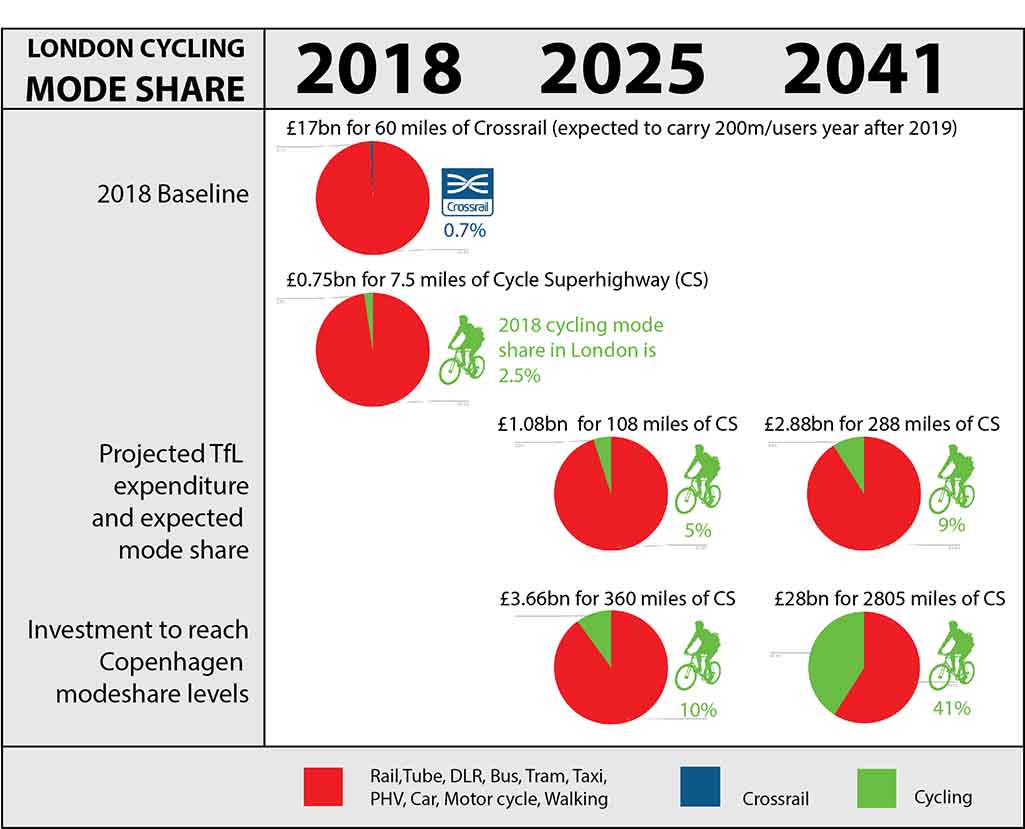
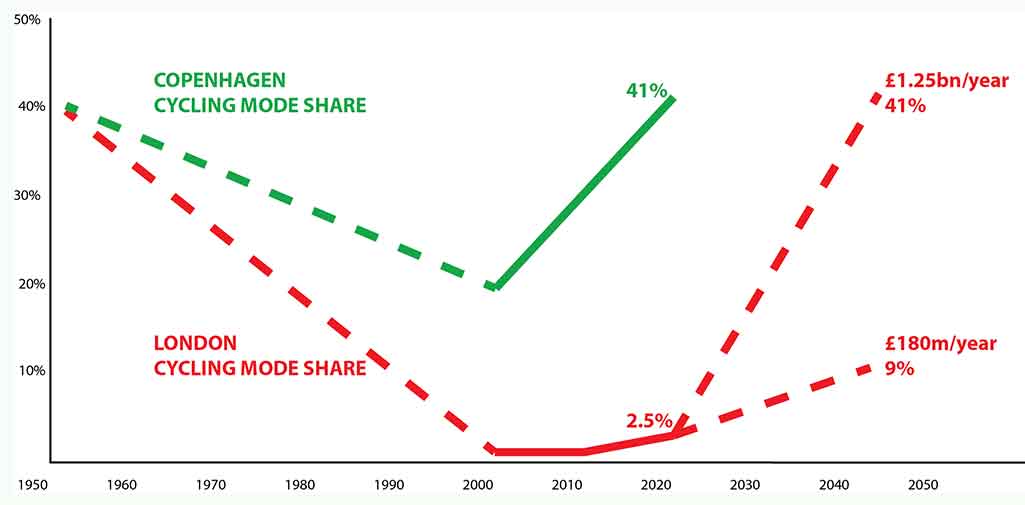
The TfL 2018 London Cycle Action Plan is strong on intentions, vague on phasing and vague on costings. So here’s a bash at filling in the blanks. The above chart shows (1) the 9% expected outcome for London if current policies are projected to 2041 (2) the investment required to ‘Copenhagenize‘ London with a cycling mode share of 41%.
The London Infastructure Plan 2050 (Mayor of London, 2014) proclaimed that: ‘the aims for cycling are to reach levels seen in cities such as Amsterdam and Copenhagen’ 1. This is followed by an incorrect figure: the London plan is for ‘cycling’s mode share for all trips increasing to at least 10 per cent’. Copenhagen’s mode share was 41% in 2018.
The Plan 2050 also has an unrealistic ‘indicative cost’ of £2-£4 billion for a ‘comprehensive network of high quality cycle and pedestrian routes’. This is maybe a tenth of the actual cost (about, £28 billion, as detailed below) yet less than the estimated £30bn billion cost of the second phase of Crossrail 2 .
Though costing more than £2- £4 billion, a London Cycleway Network would provide outstanding value for money and would accommodate up to 18 times as many extra trips/year as Crossrail 1 . Physically the cycle network could be built in 5 years. Financially it could be phased over 5, 25 or more years. Having taken the decision to Copenhagenize London transport, it is time to decide how quickly the cycleway network should be built. The costs and benefits of rail and cycle investments must be systematically assessed.
The approximate costs for London cycle infrastructure (at 2018 prices) are:
- Superhighways: £10-£12m/mile
- Quietways: £1-£2m/mile
- Mini-Hollands (like Waltham Forest, using traffic calming, filtered permeability and cycle lanes) £30-£60m/borough
A comparison with Copenhagen
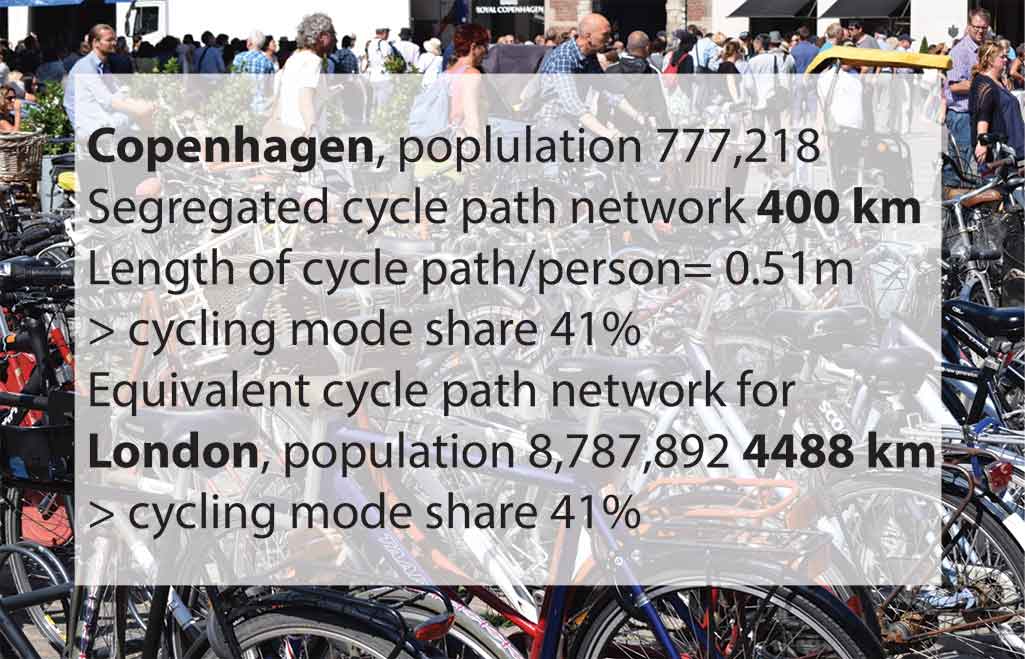
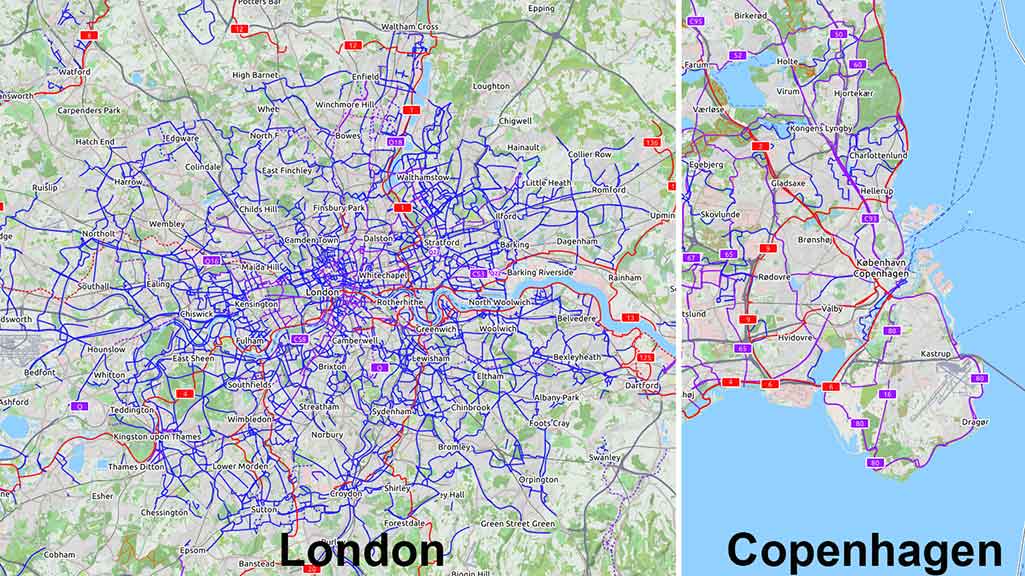
Copenhagen is a cycling capital of the first order. It is 1/11th the size of London. It has 250 miles (400 km) of segregated cycle paths. The area of the city is 68.9 sq miles. The population is 0.77 million. The density is 11,000/sq mile. The diameter is 6.5 sq miles. The cycling mode share is 41%. The length of cycle path amounts to 0.5146 metres/person.
London has 7.5 miles (12 km) of good quality segregated cycle superhighway on A-to-B commuter desire lines. The area of the city is 607 sq miles. The population is 8.8 million. The density is 14,500/sq mile. The diameter of the M25 is 40-50 miles. The cycling mode share is 2.5%. The length of cycle path amounts to 0.0014 metres/person.
In the 1940s the cycling mode share was over 40% in both London and Copenhagen. In 2000 it was 20% in Copenhagen and 1 % in London. In 2018 it was 41% in Copenhagen and 2.5% in London (see graph below). The level of cycling investment/person is also higher in Copenhagen. (London: £2/head in 2004, £17/head in 2016, £22.50/head in 2019; Copenhagen: average £35/head from 2004-2016). One would expect investment to be higher in London because of the low level of investment in the twentieth century.
London’s cycle infrastructure in 2018-19
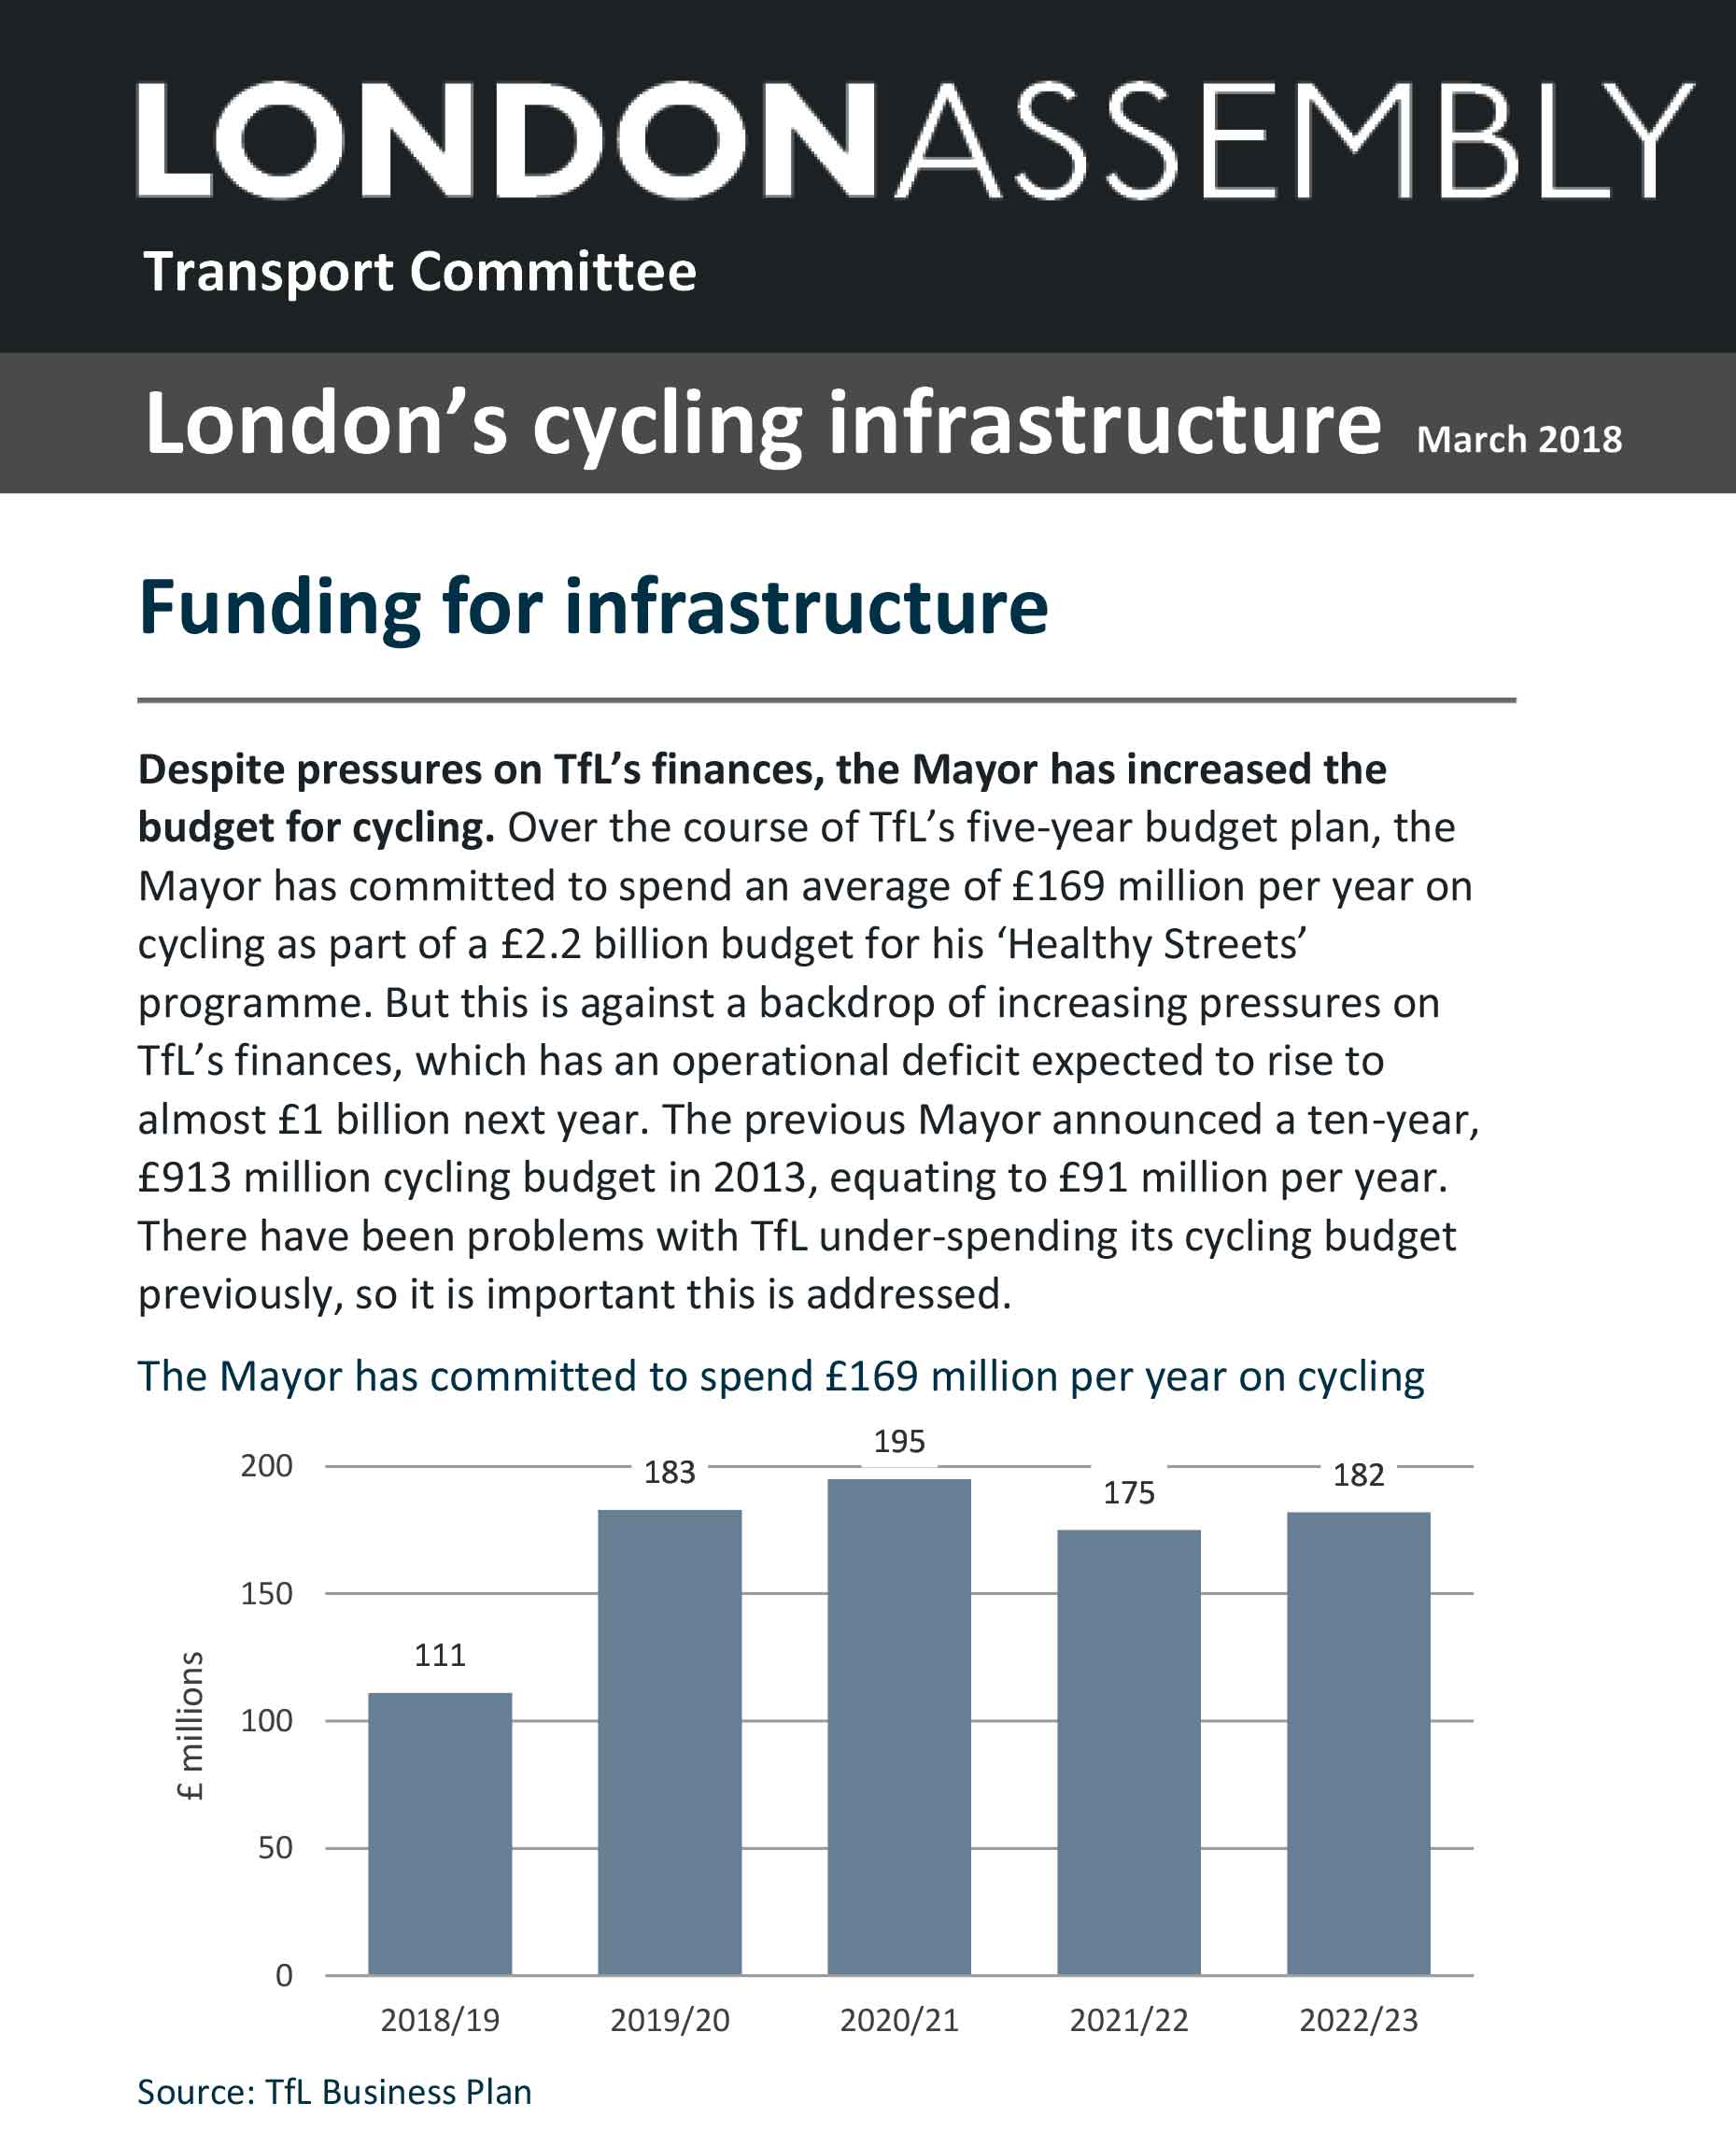
The so-called London Cycle Network is a route network. It is not an infrastructure network. So we should focus on the 2015-17 cycle superhighways. In March 2018 the London Assembly put their extent at 7.5 miles (12 km) [‘cycleway’ is used on this website to mean a high quality facility designed for safe cycling]. TfL also built 87 miles of quietway in 2018 at a cost of £111m (£1.3m/mile) (see reviews of quietway policy).
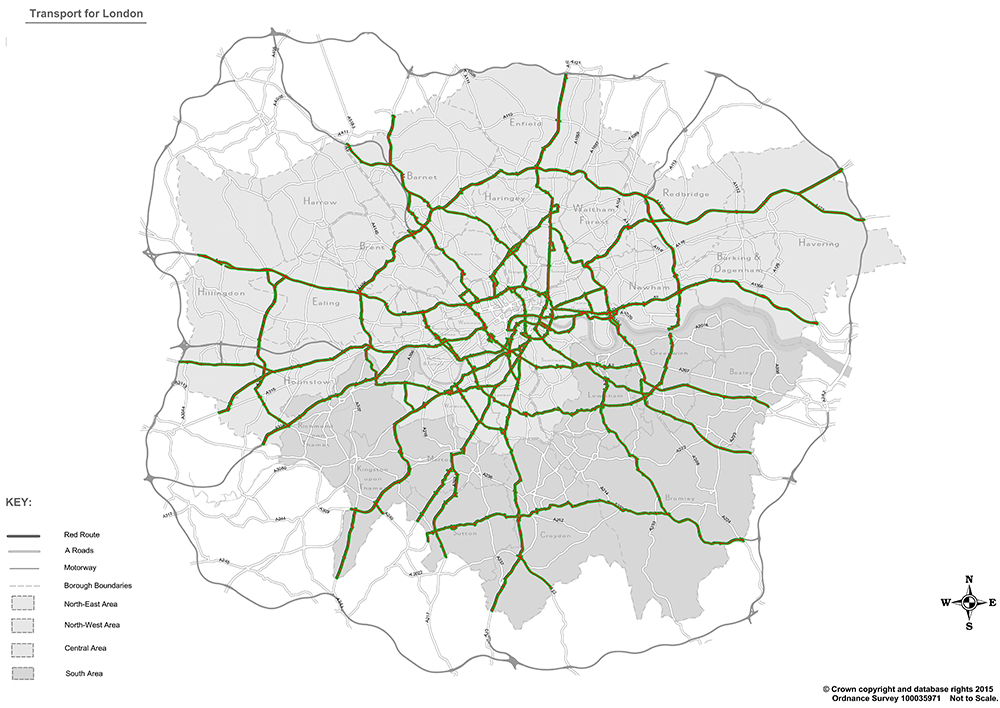
As in Central London, cycle infrastructure should be built alongside the TfL London Road Network (the TLRN Red Routes). It provides the most direct A-to-B connections in London. The TLRN should become a Red and Green Network.
The London Cycleway Network in 2025
Several outcomes are possible.
- If no new infrastructure is built the cycling mode share is likely to rise from 2.5% to 3.5% (because London’s population and its travel demand are growing)
- If TfL invests £180m/year for 6 years (=£1.08bn) it could build 108 miles of segregated cycleway and raise the mode share from 2.5% to 5% (this is TfL’s plan)
- If TfL converts its 360 miles of Redway to Redway+Greenway, the mode share would rise to 14% and the cost would be £3.6bn (£600m/year for 6 years)
- If TfL goes ahead with Copenhagenizing London and invests at the ‘Crossrail rate’ of £1.5bn/year it could build 900 miles of cycleway by 2025 and expect to raise the mode share of cycling in London to 36%
Phones, trains and cycle infrastructure require a connected network to get full value from the asset. For a day’s business (working, studying, shopping etc) cyclists want the shortest possible A-to-B connections. Quiet green surroundings are preferred but only when the routes are direct as well as environmentally delightful. In London this means cyclists want to ride, however reluctantly, on the TLRN. It has a length of 360 miles so, at £10m/mile, it would cost £3.6bn to provide segregated lanes.
The London Cycleway Network in 2041
TfL’s reason for using 2041 as a planning date is unclear. But two of the alternatives for the condition of London’s cycle infrastructure in that year are:
- If London continues to invest in cycling at the 2019 rate of £180m/year it is likely to achieve a mode share of 9% by 2041. It would take 155 years to reach Copenhagen’s 41% mode share: too long for most of us to wait.
- If London decides to raise the investment level to £1.28 billion/year it can increase the mode share to 41% by 2041 [41 for ’41]. The cost, £28 bn for a 2,805 mile cycleway network, would be less than the projected cost of Crossrail 2 (£30bn).
A 41% cycling mode share the London Cycleway Network would be carrying 10.9m journeys/day which is 18 times as many as Crossrail 1. TfL predict that by 2050 London travel demand will rise by 10.7m trips/day (from 26.8m to 37.52m). To accommodate this expansion using rail infrastructure, 18 new lines with Crossrail capacity would be required. At 2018 Crossrail prices, this would cost £374bn (£17bn/year for 22 years). A London Cycleway Network is the only financially viable way of providing London with the additional travel capacity TfL predicts it will require.
Videos about London bicycle transport planning
If you have read to here you might also like to see some videos about planning for bicycle transport:
- 16 Principles for Cycleway Network Planning
- Four step model for bicycle network infrastructure planning
- Sustainable Mass Rapid Transit by light rail, bus and bicycle: a comparison
Notes
- Crossrail 1 was approved in 2007 and construction began in 2009. The predicted cost-overrun from 2018-19 (£1.7bn) is close to the cycling budget for 10 years. Crossrail 1 was scheduled to open in 2018 but this did not happen. Crossrail 2 is under consideration and consultations have begun.
- Quotes from the London Infrastructure Plan 2050 (Mayor of London, 2014) Page 14: ‘Under the central population projection, this would mean an increase of 35-40 per cent in the number of trips by 2050, with even higher growth in demand for public transport’. Page 50: ‘the aims for cycling are to reach levels seen in cities such as Amsterdam and Copenhagen’. Page 98 ‘cycling’s mode share for all trips increasing to at least 10 per cent’. Page 98: ‘To enable this, by 2050 London should have a comprehensive, high quality cycle network catering for all journey types and cyclists of all ages. This should include 200 kms of new Dutch-style cycle highways, which will help remove significant barriers to cycling in London’. Page 98: ‘Transport Requirement 23 – A comprehensive network of high quality cycle and pedestrian routes (indicative cost: £2-4 billion)’.
- Graph showing changes in cycling mode share in Copenhagen and London from the 1940s to 2018.
Tom Turner